
Why Mobility Intelligence is becoming the next big category in mobility
The problem is no longer finding the right mobility solutions, but making all those work together. That is exactly where Mobility Intelligence comes in.
For many finance and fleet teams, managing company vehicles feels like handling too many moving parts. Leasing contracts, fuel cards, maintenance providers and insurance policies all add complexity. More recently, electric vehicle charging networks have become another factor to track.
Each supplier often brings its own invoices, billing cycles and reporting systems. The result is a fragmented fleet spend that is difficult to monitor and control.
When data is scattered across multiple suppliers and siloed platforms, blind spots appear. Low-usage vehicles add unnecessary overheads, mileage records may not match, and duplicate contracts can slip through unnoticed. Such issues make it challenging to calculate total cost of ownership (TCO) and keep suppliers accountable.

The modern fleet rarely runs through one provider. Cars may be leased from one supplier, fuel cards from another, EV charging from a third, and maintenance from local workshops. Managing this mix means chasing spreadsheets, PDFs and portal downloads across different formats and reporting standards. Lack of clarity makes it difficult to compare supplier performance or identify inconsistencies. Without unified reporting, anomalies can go unnoticed for months, leading to missed opportunities to reduce costs.
According to the Ayvens 2025 Car Cost Index, leasing a mid-range car in Europe costs around €1,090 per month, or €13,100 annually. Reducing costs by even 5–10% per vehicle can generate significant savings across a fleet.

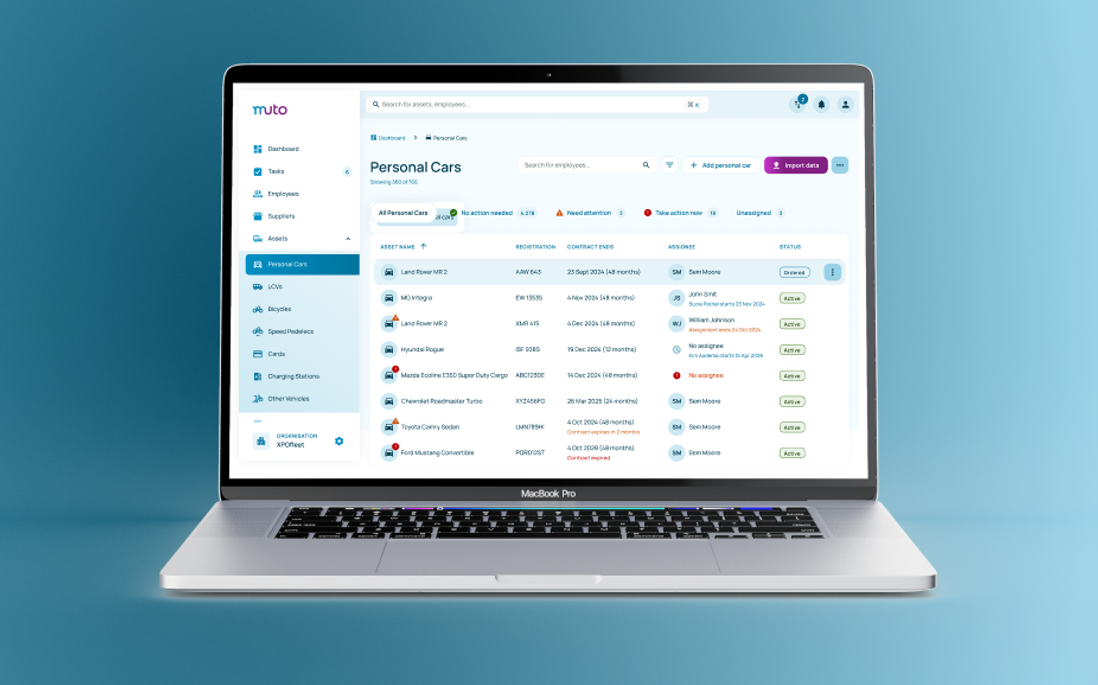
Centralising fleet data gives finance and fleet teams a complete overview. By consolidating contracts, invoices and usage metrics, decision-making becomes more informed and proactive.
A unified dashboard enables real-time reporting and supplier comparisons. For example, fuel card savings can be tracked, EV charging rates compared, and maintenance costs monitored across providers.
Centralising cost data may appear complex, but a structured approach makes it achievable. A six-step framework can help:
The aim is to move from manual data collection to proactive fleet cost monitoring, enabling timely interventions and more efficient budget control
Organisations adopting centralised fleet management typically save between 10% and 15% on costs. Savings come from removing duplicate services, retiring underused vehicles and renegotiating contracts. Telematics and GPS tracking can reduce fuel and maintenance expenses by up to 16%, and insurance by 13%.
For example, a Belgian company managing multiple leasing and fuel providers implemented a unified dashboard. Within 12 months, it retired low-usage vehicles and renegotiated contracts, cutting annual spend by nearly €120,000. Beyond savings, the company also benefited from faster reporting and improved supplier accountability.
Fleet cost visibility is a strategic advantage for both finance and fleet teams. With unified data, organisations can manage budgets proactively, benchmark suppliers, and identify savings opportunities.
Beyond cost control, centralisation improves sustainability reporting and ensures fair allocation of mobility benefits. With platforms like Muto, businesses can remove blind spots, reduce fleet expenses and maximise the value of mobility data.
What is fleet cost visibility?
How can companies reduce fleet costs?
Why is mileage tracking important for fleet management?
What is a fleet single source of truth?
What are common fleet cost blind spots?
European Commission — Sustainable Transport: https://transport.ec.europa.eu
CIPD — Employee Benefits and Mobility: https://www.cipd.org
Ayvens Car Cost Index 2025: https://www.ayvens.com/en-gb/support-and-insights/insights-hub/cost/car-cost-index/
Verizon Connect — Fleet Cost Savings: https://www.verizonconnect.com/resources/article/fleet-management-cost-savings-strategies/
The problem is no longer finding the right mobility solutions, but making all those work together. That is exactly where Mobility Intelligence comes in.
In this article, we explain why traditional car policies are becoming outdated and how AI can help you build, optimise, and manage modern mobility policies.

